- Home >
- Web Help >
- SeekerWorks™ >
- Gifts/Pledges - Chart/Graph Analysis
Gifts/Pledges - Chart/Graph Analysis
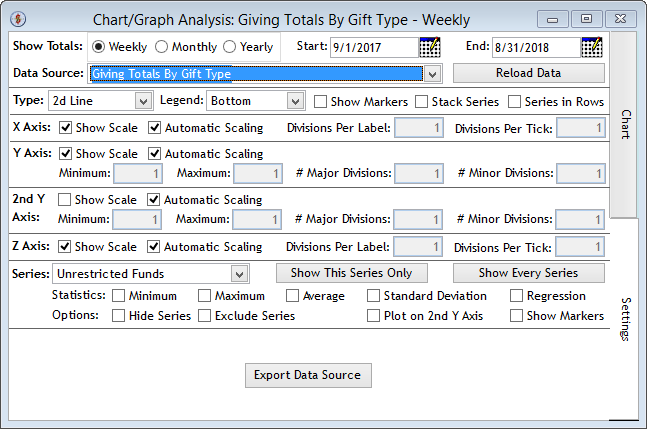
The "'Chart/Graph Analysis: xxxxx', {Settings} tab" screen enables you to determine the type of information you want to chart or graph and the settings used to display it.

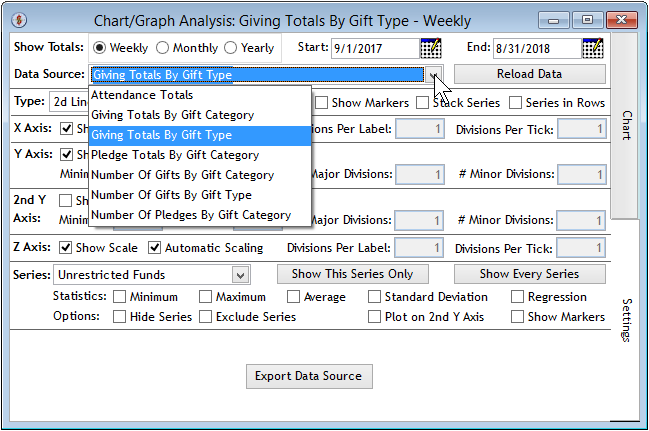
The "'Chart/Graph Analysis: xxxxx', {Settings} tab Data Source Options" screen shows additional information in the drop-down list of data sources, which include Attendance Totals, Giving Totals By Gift Category (Fund), Giving Totals By Gift Type, Pledge Totals By Gift Category (Fund), or histogram information like the Number Of Gifts By Gift Category (Fund),the Number Of Gifts By Gift Type, and the Number Of Pledges By Gift Category (Fund).

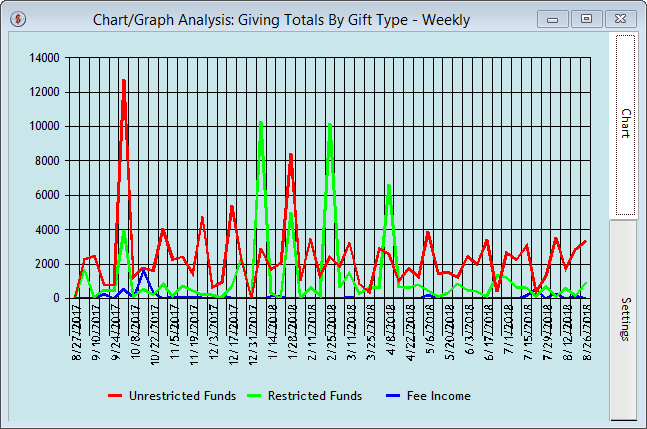
The "'Chart/Graph Analysis: xxxxx', {Chart} tab" screen plots the information onto a chart or graph.

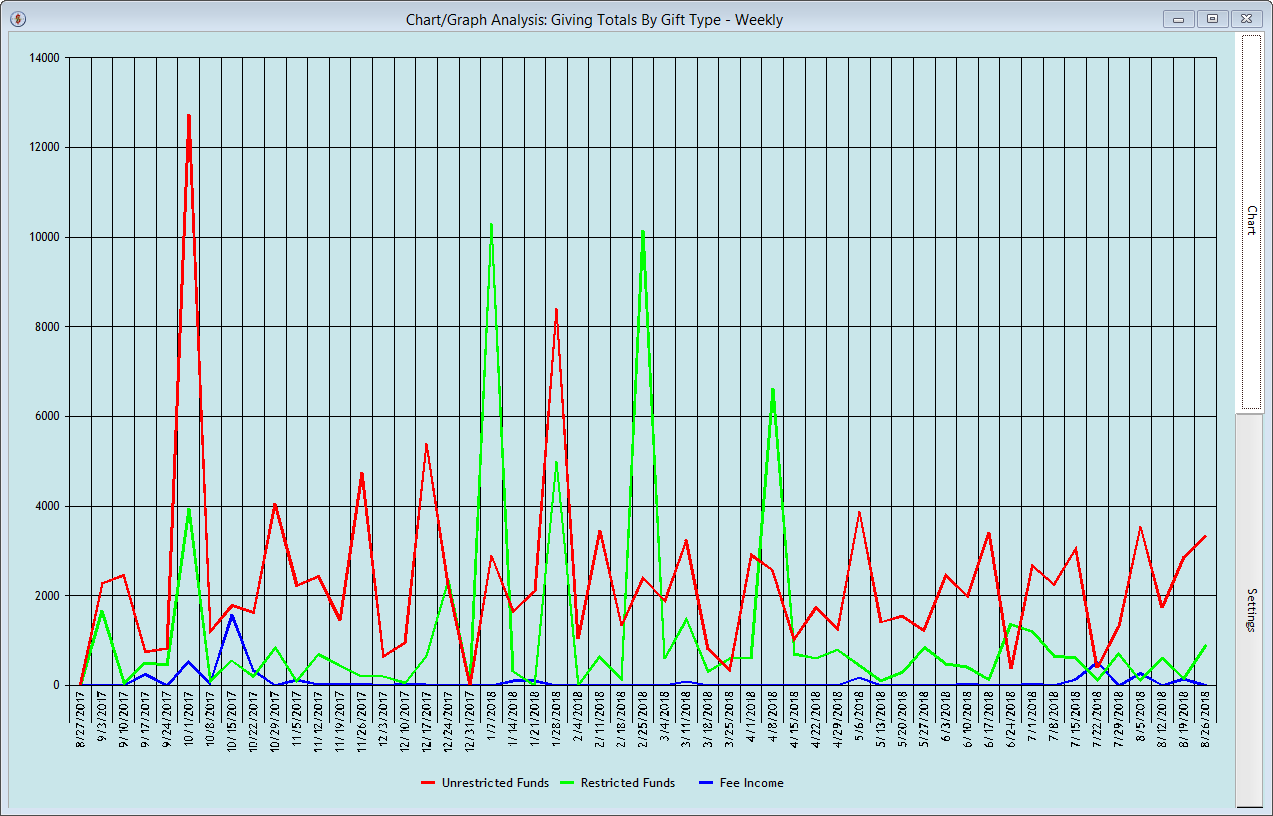
The "'Chart/Graph Analysis: xxxxx', {Chart} tab resized larger" screen shows the same information enlarged to fit the size of your screen. This is attained by clicking the maximize window button on the top right of the screen's title bar.

Right side navigation links:
More Screens:
People:
Gifts/Pledges:
Chart/Graph Analysis